

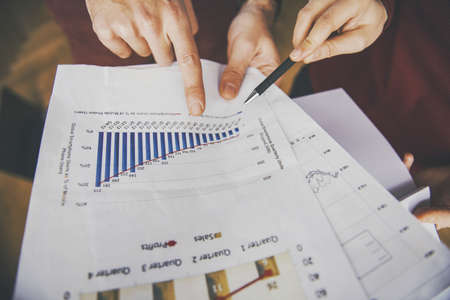
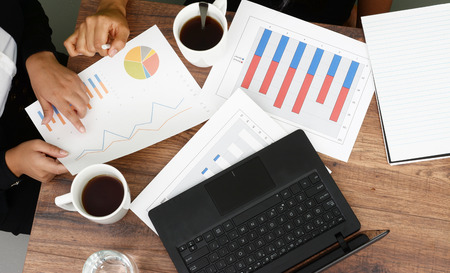
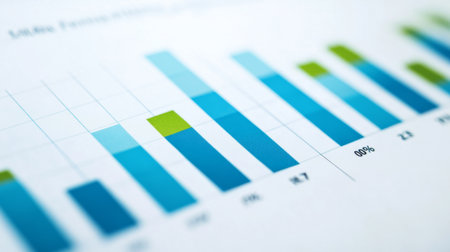
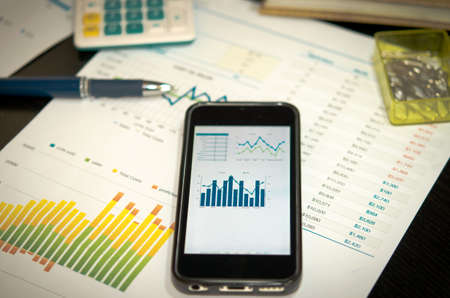
Team work with results and reports
Коллекция по умолчанию
Коллекция по умолчанию
Создать новую
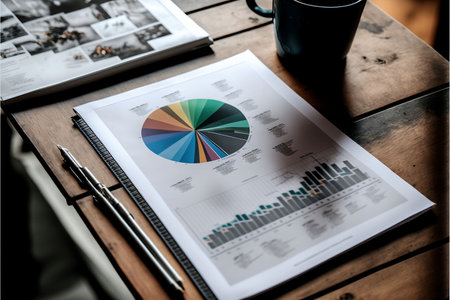
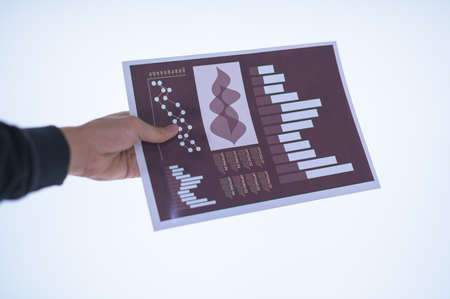
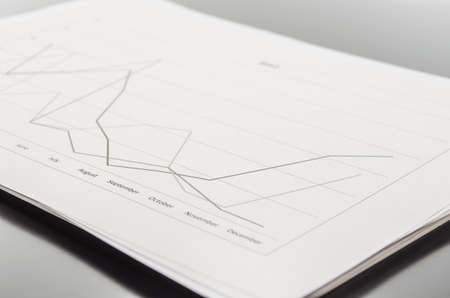
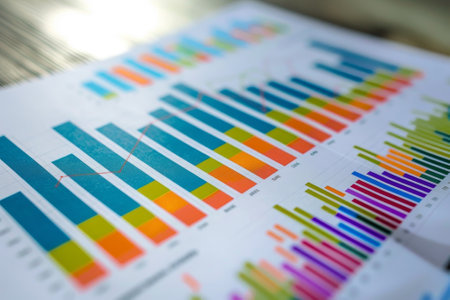
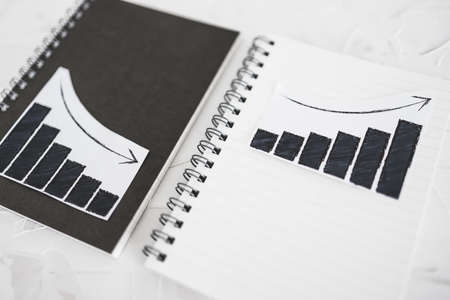
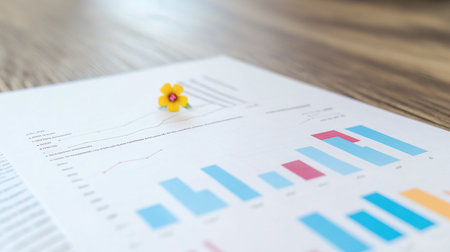
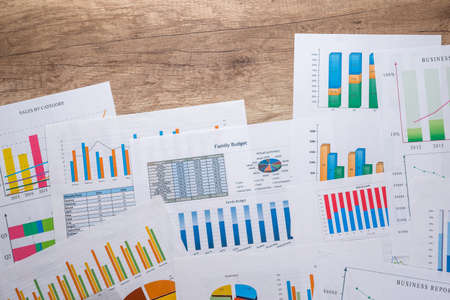
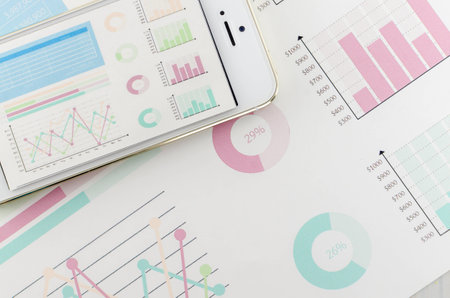
An AI generated illustration of project management graphs charts paper
Коллекция по умолчанию
Коллекция по умолчанию
Создать новую
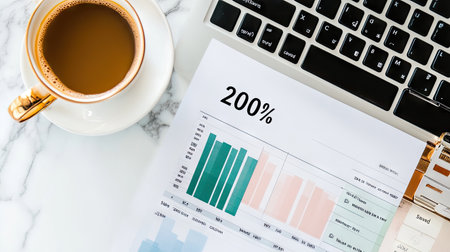
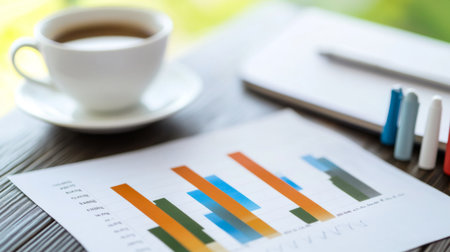
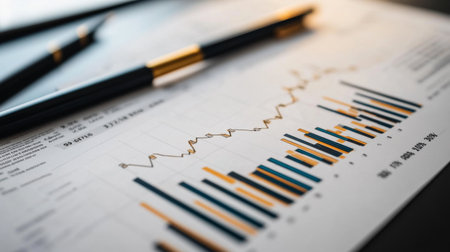
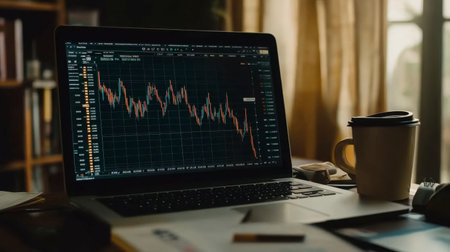
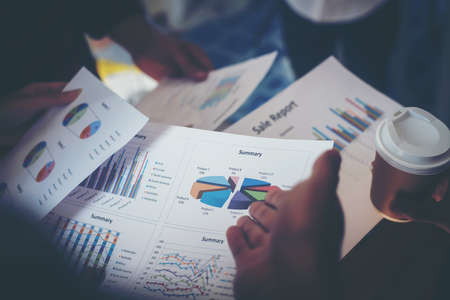
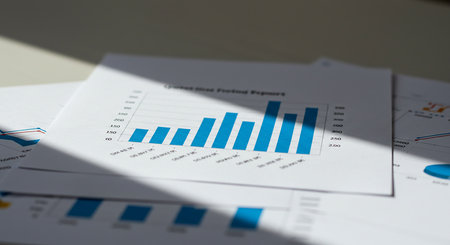
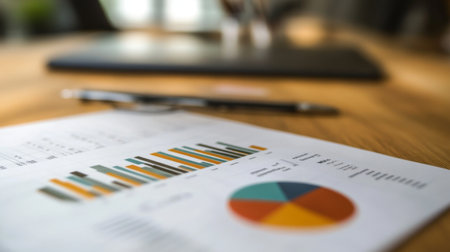
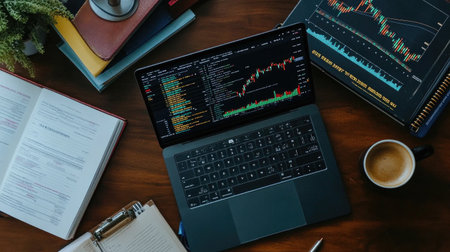
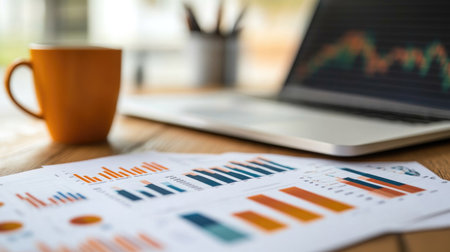
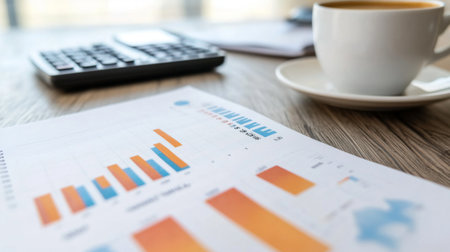
A modern workspace scene featuring a cup of coffee beside a laptop, with charts and graphs showcasing data analysis for productivity and business growth.
Коллекция по умолчанию
Коллекция по умолчанию
Создать новую
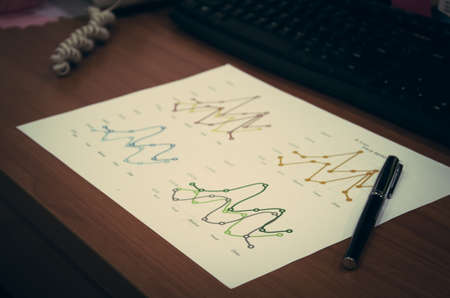
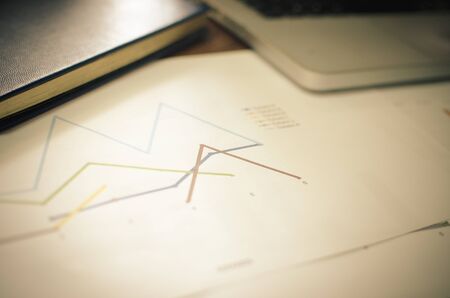
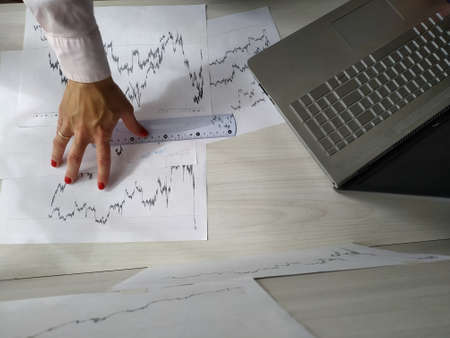
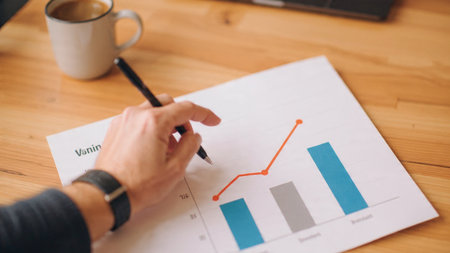
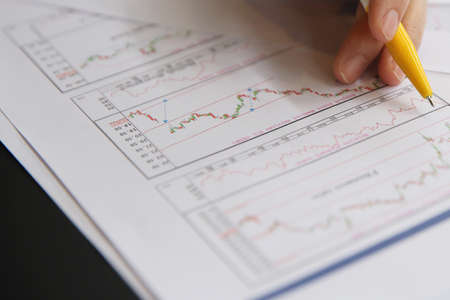
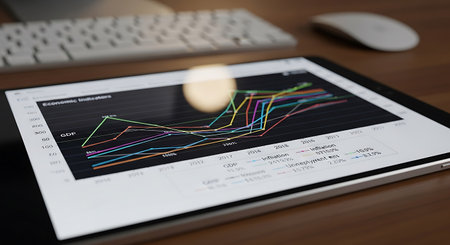
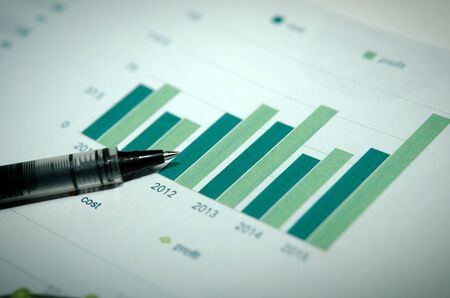
Line graph on desk and pen. Vintage filter
Коллекция по умолчанию
Коллекция по умолчанию
Создать новую

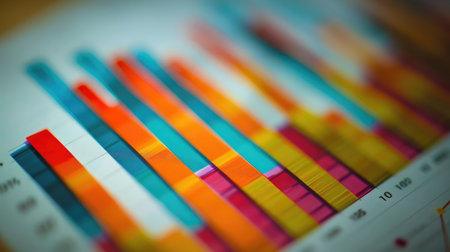
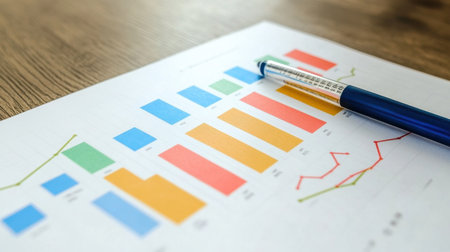
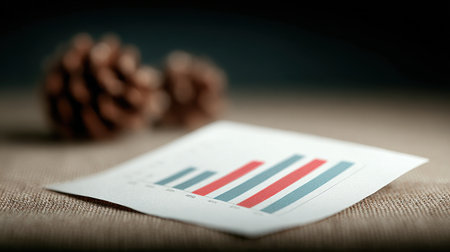
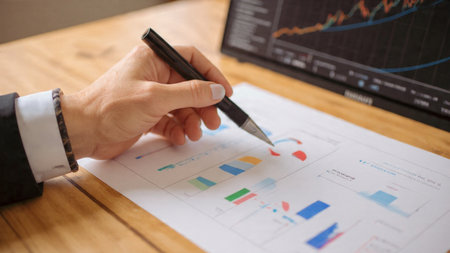
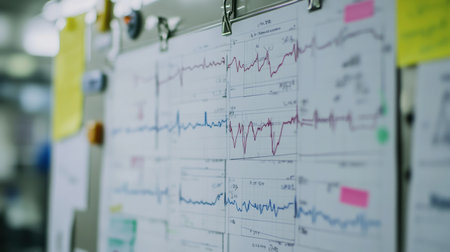
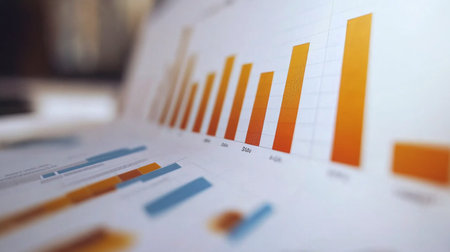
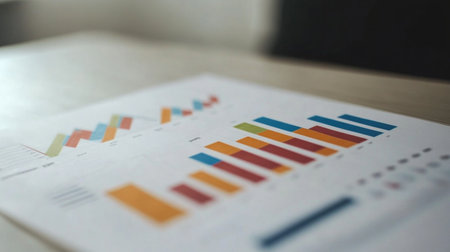
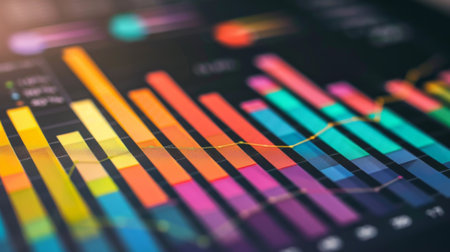
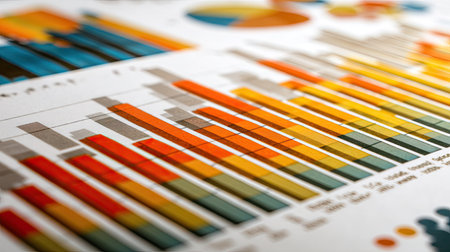
Close-up of a stock market analysis chart with a mix of bar graphs and line graphs highlighting key data
Коллекция по умолчанию
Коллекция по умолчанию
Создать новую
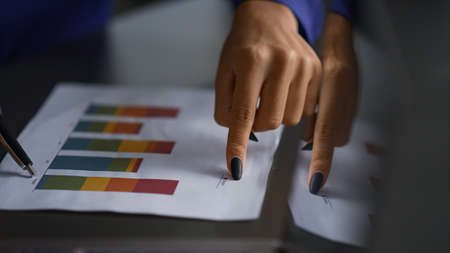
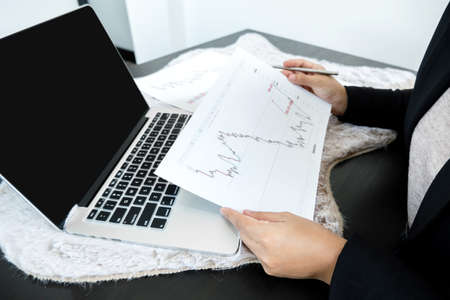
Business woman hands analyze diagram graph show financial charts information in office table. Close up female executive explaining presenting marketing data on conference. Corporate analysis concept.
Коллекция по умолчанию
Коллекция по умолчанию
Создать новую

Shallow depth of field (selective focus) with details of a chart showing the stock market crash from March 2020 due to the Covid-19 pandemic on a computer screen (S&P500 index)
Коллекция по умолчанию
Коллекция по умолчанию
Создать новую

Annual business report. Accountability paperwork. Hands holding a heap of documents with graphs and statistics
Коллекция по умолчанию
Коллекция по умолчанию
Создать новую
Business reports
Коллекция по умолчанию
Коллекция по умолчанию
Создать новую
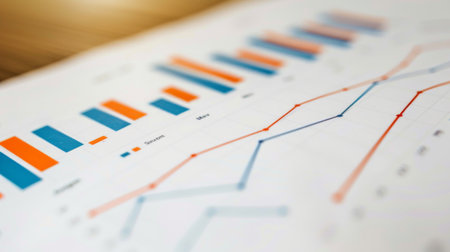
A close-up of a business report with colorful bar and line graphs.
Коллекция по умолчанию
Коллекция по умолчанию
Создать новую

Analysis of data from graphs. select focus.
Коллекция по умолчанию
Коллекция по умолчанию
Создать новую

Colored sticker stripes on business analytics chart closeup
Коллекция по умолчанию
Коллекция по умолчанию
Создать новую
Businessman hand holding a document. Scenes white background.
Коллекция по умолчанию
Коллекция по умолчанию
Создать новую
Monthly percentage bar chart showing financial comparison of 2026 budget versus actual performance data displayed on digital screen. Results tracking.
Коллекция по умолчанию
Коллекция по умолчанию
Создать новую

Business plan documents and charts for eco-tourism startup on rustic wooden table
Коллекция по умолчанию
Коллекция по умолчанию
Создать новую
A coffee cup beside colorful charts on a wooden table, perfect for depicting analysis, business meetings, and workspace environments. Ideal for marketing and financial themes.
Коллекция по умолчанию
Коллекция по умолчанию
Создать новую
documents on office table with laptop computer and graph financial with social network diagram - Filter vintage
Коллекция по умолчанию
Коллекция по умолчанию
Создать новую

Virus pandemic covid-19 map on pc screen, global infection, internet.
Коллекция по умолчанию
Коллекция по умолчанию
Создать новую

Businesswoman holding a notepad at her desk, a group of businessmen attending a meeting and holding meeting materials, brainstorming meeting to plan a company's growth. Business meeting idea.
Коллекция по умолчанию
Коллекция по умолчанию
Создать новую

Graph of market share with black pen in business concept
Коллекция по умолчанию
Коллекция по умолчанию
Создать новую

Businessmen miniature figure standing on investment and profit graph for analysis and discussion.
Коллекция по умолчанию
Коллекция по умолчанию
Создать новую
Clean desk setup for strategic planning with annual growth projection
Коллекция по умолчанию
Коллекция по умолчанию
Создать новую
A close-up of a printed gold price chart with annotations and trend lines, placed on a desk with financial reports and a pen, emphasizing detailed market analysis.
Коллекция по умолчанию
Коллекция по умолчанию
Создать новую
Graph document on a black table
Коллекция по умолчанию
Коллекция по умолчанию
Создать новую
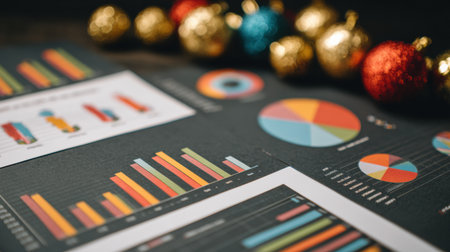
Charts and graphs display data insights on a table, while vibrant holiday ornaments add a festive touch to the workspace, creating a cheerful atmosphere.
Коллекция по умолчанию
Коллекция по умолчанию
Создать новую
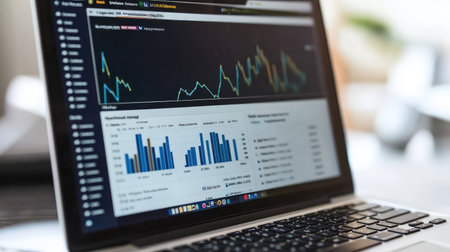
Close-up view of a laptop displaying data analysis with charts and graphs, perfect for showcasing technology, finance, or business analytics themes.
Коллекция по умолчанию
Коллекция по умолчанию
Создать новую
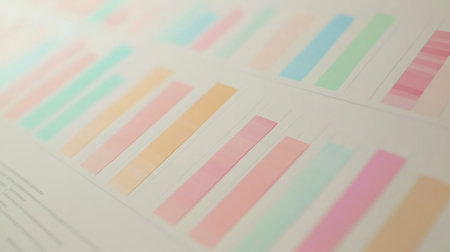
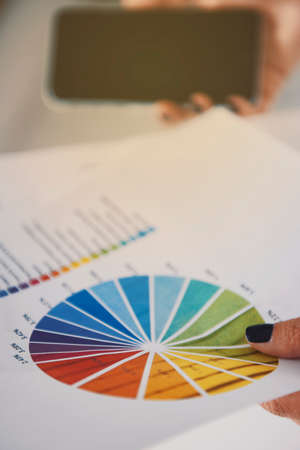
A vibrant display of pastel color swatches arranged on a light background, ideal for exploring color combinations and creative design concepts. Perfect for artists and designers.
Коллекция по умолчанию
Коллекция по умолчанию
Создать новую

A closeup photo of a man holding a financial chart in his hands and looking at it. The concept of business growth and finance. Risk assessment. Stock growth chart.
Коллекция по умолчанию
Коллекция по умолчанию
Создать новую
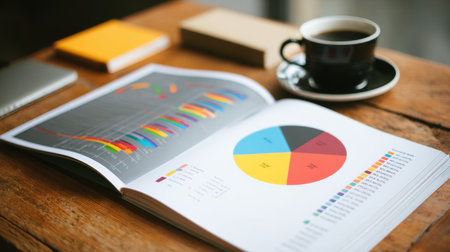
A business report featuring colorful graphs and charts laid open on a rustic wooden table alongside a coffee cup and notebooks, perfect for analysis or presentations.
Коллекция по умолчанию
Коллекция по умолчанию
Создать новую
Stylish eyeglasses and colorful chart on the white work table. Business concept.
Коллекция по умолчанию
Коллекция по умолчанию
Создать новую

image of the financial graph on a computer monitor.
Коллекция по умолчанию
Коллекция по умолчанию
Создать новую

Charts Graphs paper. Financial development, Banking Account, Statistics, Investment Analytic research data economy, Stock exchange Business office company meeting concept.
Коллекция по умолчанию
Коллекция по умолчанию
Создать новую
Vibrant bar graphs displayed on an office desk, showcasing business metrics and statistics. Ideal for content related to finance, analysis, and performance.
Коллекция по умолчанию
Коллекция по умолчанию
Создать новую

A stock market graph on a black background.
Коллекция по умолчанию
Коллекция по умолчанию
Создать новую

ballpoint pen indicates income graphs lying on the table
Коллекция по умолчанию
Коллекция по умолчанию
Создать новую

Financial report and laptop on business desk
Коллекция по умолчанию
Коллекция по умолчанию
Создать новую

Close-up photo of sale statistic report document at office table
Коллекция по умолчанию
Коллекция по умолчанию
Создать новую
A graph placed on a laptop computer with a coffee cup on the black table in the office
Коллекция по умолчанию
Коллекция по умолчанию
Создать новую
A business growth chart displayed on a wooden table represents data analysis and strategic planning. Ideal for finance and marketing themes.
Коллекция по умолчанию
Коллекция по умолчанию
Создать новую

Notebook work with statistics on the table
Коллекция по умолчанию
Коллекция по умолчанию
Создать новую
A colorful chart with many different colored bars and lines. The chart is titled Trends in the Stock Market
Коллекция по умолчанию
Коллекция по умолчанию
Создать новую

business graph with pen
Коллекция по умолчанию
Коллекция по умолчанию
Создать новую
woman examines charts of bitcoin at work table and computer.
Коллекция по умолчанию
Коллекция по умолчанию
Создать новую
A piece of paper with a graph on it is on a table. The graph is a bar chart with a red and blue line. The paper is crumpled and has a few creases
Коллекция по умолчанию
Коллекция по умолчанию
Создать новую
Woman holding business reports
Коллекция по умолчанию
Коллекция по умолчанию
Создать новую
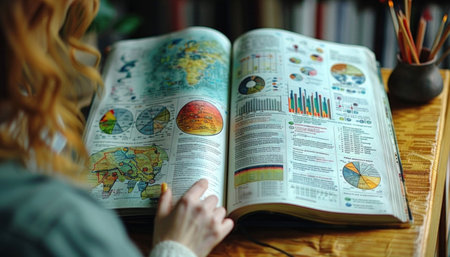
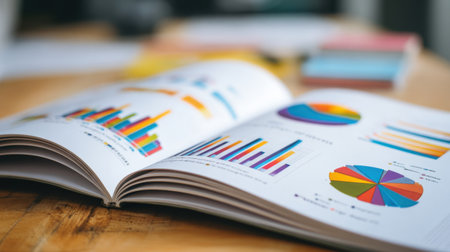
A young woman with long red hair studies a large book filled with colorful charts and diagrams, looking focused and concentrated.
Коллекция по умолчанию
Коллекция по умолчанию
Создать новую

Radiated emissions spectrogram with limit lines in EMC electromagnetic compatibility test report
Коллекция по умолчанию
Коллекция по умолчанию
Создать новую
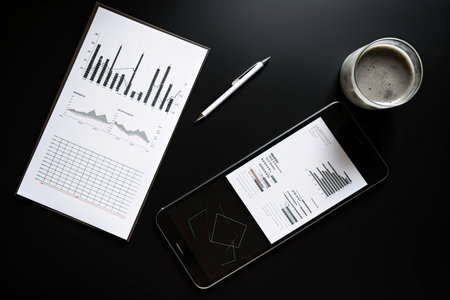
Smartphone and Tablet pc with financial charts and graphs on office desk, business concept
Коллекция по умолчанию
Коллекция по умолчанию
Создать новую
A modern wooden desk showcasing economic trend charts on a laptop, surrounded by research papers and a coffee cup.
Коллекция по умолчанию
Коллекция по умолчанию
Создать новую
A warm-toned desk displaying financial dashboards next to economic printouts and coffee.
Коллекция по умолчанию
Коллекция по умолчанию
Создать новую
Office Woman hand Working on the Business Papers and tablet
Коллекция по умолчанию
Коллекция по умолчанию
Создать новую
A modern workspace featuring a laptop displaying financial graphs with a cup of coffee in a cozy setting. Ideal for concepts around finance and productivity.
Коллекция по умолчанию
Коллекция по умолчанию
Создать новую
Businesswomen at the office ready to work
Коллекция по умолчанию
Коллекция по умолчанию
Создать новую
A collection of medical graphs and charts displayed on a clinic wall depicting various data readings. This image captures the essence of data-driven healthcare analysis.
Коллекция по умолчанию
Коллекция по умолчанию
Создать новую

Trader investor broker holding finger using cell phone app executing financial stock trade market trading order to buy or sell
Коллекция по умолчанию
Коллекция по умолчанию
Создать новую

Financial instruments with various types of indicators including volume analysis for professional technical analysis
Коллекция по умолчанию
Коллекция по умолчанию
Создать новую
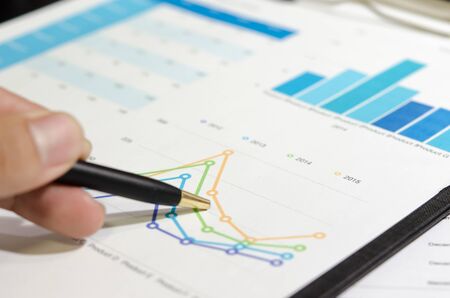
Chart and pen on the desk.
Коллекция по умолчанию
Коллекция по умолчанию
Создать новую
Business meeting coworkers discussing the project planning in office.
Коллекция по умолчанию
Коллекция по умолчанию
Создать новую
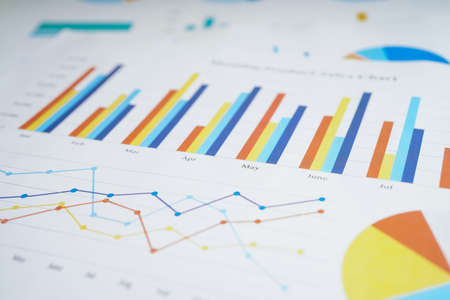
A close-up view of colorful charts and graphs representing business growth and analysis. Ideal for finance, marketing, and business presentations.
Коллекция по умолчанию
Коллекция по умолчанию
Создать новую
business analysis and statistics concept, positive and negative trends on graphs on notebooks side by side
Коллекция по умолчанию
Коллекция по умолчанию
Создать новую
financial chart on the table, business concept, shallow depth of field
Коллекция по умолчанию
Коллекция по умолчанию
Создать новую
financial charts and graphs on the table of the businessman, business concept
Коллекция по умолчанию
Коллекция по умолчанию
Создать новую

Closeup of businessman analysing a graph
Коллекция по умолчанию
Коллекция по умолчанию
Создать новую
Close-up of digital tablet with financial chart on screen. Business concept
Коллекция по умолчанию
Коллекция по умолчанию
Создать новую
A close-up of a financial report with multiple bar charts and performance metrics, emphasizing detailed data analysis and business insights on a clean white desk.
Коллекция по умолчанию
Коллекция по умолчанию
Создать новую
A colorfully designed business analysis chart is placed on a rustic wooden table. A blue coffee cup and an orange pen are positioned nearby, suggesting a focused work environment.
Коллекция по умолчанию
Коллекция по умолчанию
Создать новую

The Stock Exchange, Streaming Trade Screen, The stock screen shows a list of stocks with reduced value.
Коллекция по умолчанию
Коллекция по умолчанию
Создать новую

Woman hand Trading online on tablet with business paper and coffee
Коллекция по умолчанию
Коллекция по умолчанию
Создать новую
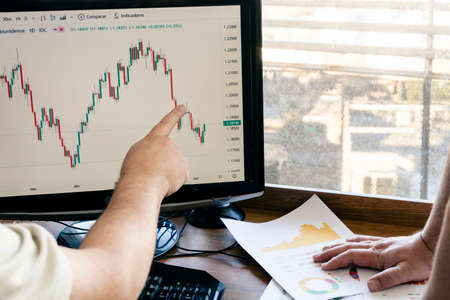
A stock investor shows another investor the behavior of a stock on the stock market on the monitor. Concept economy, stock market.
Коллекция по умолчанию
Коллекция по умолчанию
Создать новую
Charts Graphs paper. Financial development, Banking Account, Statistics, Investment Analytic research data economy, Stock exchange Business office company meeting concept.
Коллекция по умолчанию
Коллекция по умолчанию
Создать новую
working economist financial analytics papers
Коллекция по умолчанию
Коллекция по умолчанию
Создать новую

closeup Office business workplace with laptop on desk computer background document on table copy space workspace creative design books, modern interior
Коллекция по умолчанию
Коллекция по умолчанию
Создать новую
many different business graph with calculator and pen on desk.
Коллекция по умолчанию
Коллекция по умолчанию
Создать новую
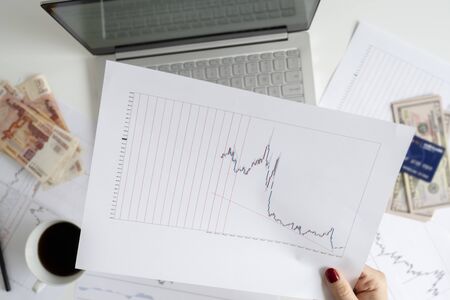
Woman freelancer. pack of banknotes fifty U.S. dollars, five thousand rubles, credit card and laptop with graphics and charts on office table. Forex exchange concept, Flat lay.
Коллекция по умолчанию
Коллекция по умолчанию
Создать новую

Business financial or stock market background. Business graph on stock market financial exchange
Коллекция по умолчанию
Коллекция по умолчанию
Создать новую

Online stock exchange application with information on screen, closeup
Коллекция по умолчанию
Коллекция по умолчанию
Создать новую
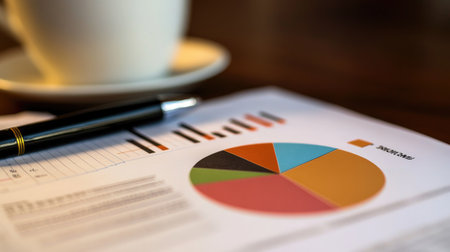
A close-up of a pie chart in a financial report, with each segment clearly labeled and color-coded, displayed on a desk with a cup of coffee and a pen.
Коллекция по умолчанию
Коллекция по умолчанию
Создать новую
A close-up of a line graph showing fluctuating trends, used to analyze market behavior or performance over time.
Коллекция по умолчанию
Коллекция по умолчанию
Создать новую
A close-up view of a colorful bar graph showing data analysis. This visual insight illustrates trends and performance metrics useful for business and finance.
Коллекция по умолчанию
Коллекция по умолчанию
Создать новую
A close-up view of business analysis documents showcasing colorful graphs and charts on a wooden table, symbolizing data studies and insights.
Коллекция по умолчанию
Коллекция по умолчанию
Создать новую
Above view flat lay of business data charts and office supplies over coral background, copy space
Коллекция по умолчанию
Коллекция по умолчанию
Создать новую
A colorful bar chart showing quarterly sales growth for a tech startup, with upward trends highlighted
Коллекция по умолчанию
Коллекция по умолчанию
Создать новую
A bird's eye view of a busy desk featuring a laptop displaying stock market charts, a coffee cup, and various office supplies, creating a productive workspace.
Коллекция по умолчанию
Коллекция по умолчанию
Создать новую
The hands of a female business brokerage are planning business investments by analyzing and calculating the stock market to find market profits.
Коллекция по умолчанию
Коллекция по умолчанию
Создать новую

Financial graphs analysis and pen.
Коллекция по умолчанию
Коллекция по умолчанию
Создать новую

Indicators including volume analysis for professional technical analysis on the monitor of a computer. Fundamental and technical analysis concept.
Коллекция по умолчанию
Коллекция по умолчанию
Создать новую
A detailed data visualization featuring colorful bar graphs and pie charts showcases analytics for business insights. This image is ideal for marketing and reports.
Коллекция по умолчанию
Коллекция по умолчанию
Создать новую
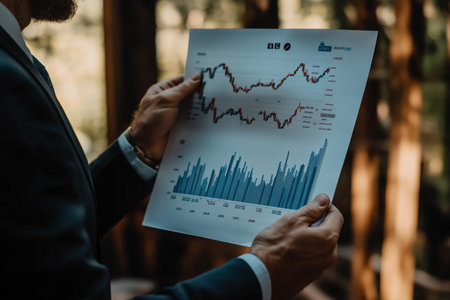
Business professional analyzing financial data in a forest setting during daylight hours
Коллекция по умолчанию
Коллекция по умолчанию
Создать новую

Close up Business people meeting to discuss the situation on the market. Business Financial Concept.
Коллекция по умолчанию
Коллекция по умолчанию
Создать новую

Hand of businessman looking documents report statistic financial with graph and chart and laptop computer and book on desk, finance and invest, digital marketing, business and communication concept.
Коллекция по умолчанию
Коллекция по умолчанию
Создать новую
Business chart with smart phone and pen
Коллекция по умолчанию
Коллекция по умолчанию
Создать новую
Graphs
Коллекция по умолчанию
Коллекция по умолчанию
Создать новую
Financial graphs analysis and pen.
Коллекция по умолчанию
Коллекция по умолчанию
Создать новую
A focused workspace with coffee, laptop, and printed data charts reflects business analysis. Ideal for themes of productivity and data-driven decision-making.
Коллекция по умолчанию
Коллекция по умолчанию
Создать новую
A close-up view of an open report featuring colorful graphs and charts on a wooden table. Ideal for illustrating business analysis, research, and statistical insights.
Коллекция по умолчанию
Коллекция по умолчанию
Создать новую
A high-resolution image of a financial report featuring colorful bar charts and graphs, placed on a desk with a calculator, notepad, and a cup of coffee.
Коллекция по умолчанию
Коллекция по умолчанию
Создать новую
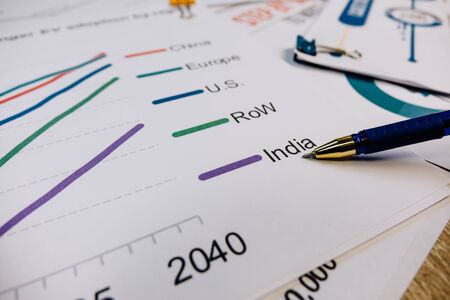
the pen points to the chart layer with the word India.
Коллекция по умолчанию
Коллекция по умолчанию
Создать новую
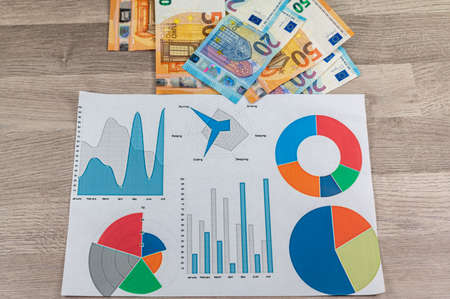
20 and 50 euro banknotes and wallet and cigar on wood background
Коллекция по умолчанию
Коллекция по умолчанию
Создать новую

Background of business graph
Коллекция по умолчанию
Коллекция по умолчанию
Создать новую

graph of financial growth on a computer monitor.
Коллекция по умолчанию
Коллекция по умолчанию
Создать новую
Legion-Media
Создайте свои проекты на основе качественных стоковых фотографий и видео.


Copyright © Legion-Media.